The showcase features indicators related to demographics, material living conditions, work, retirement, lifestyle, health and well-being, and the social participation of seniors.
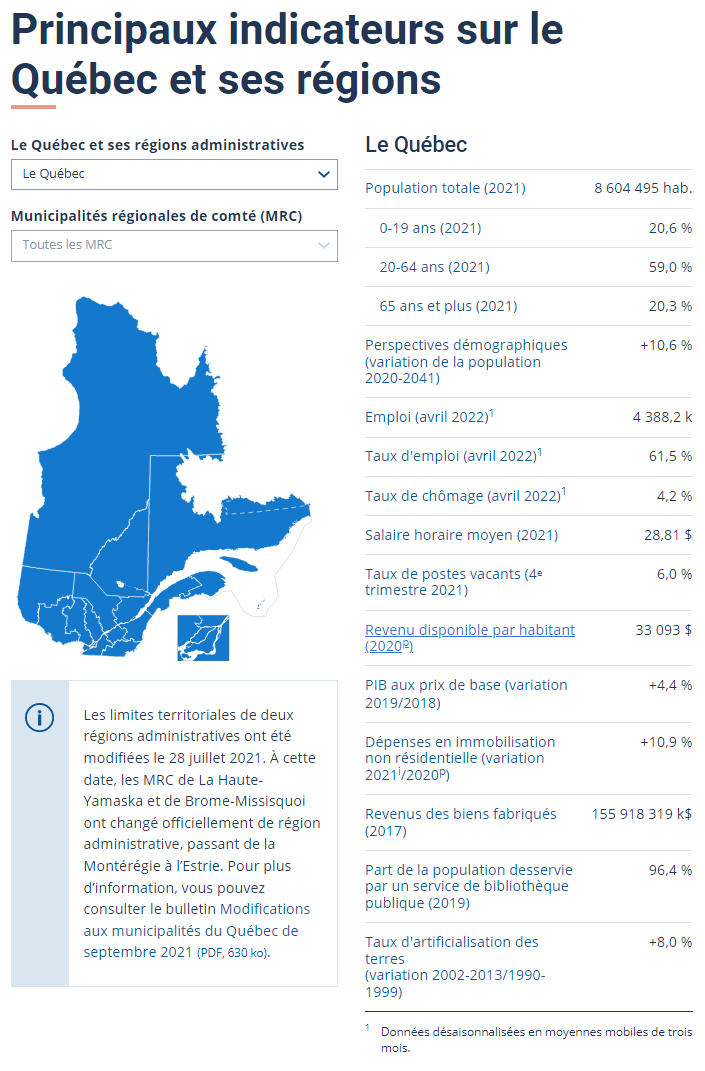
Economic, demographic, cultural and environmental indicators for all of Québec, its administrative regions and their RCMs. Latest update: Job vacancy rate.
Main results presented in a summary dashboard. Detailed information is also provided for each indicator. Update: Taux de faible revenu selon la Mesure du panier de consommation; Anomalies de température; Dépassements de la concentration de particules fines dans l’air.
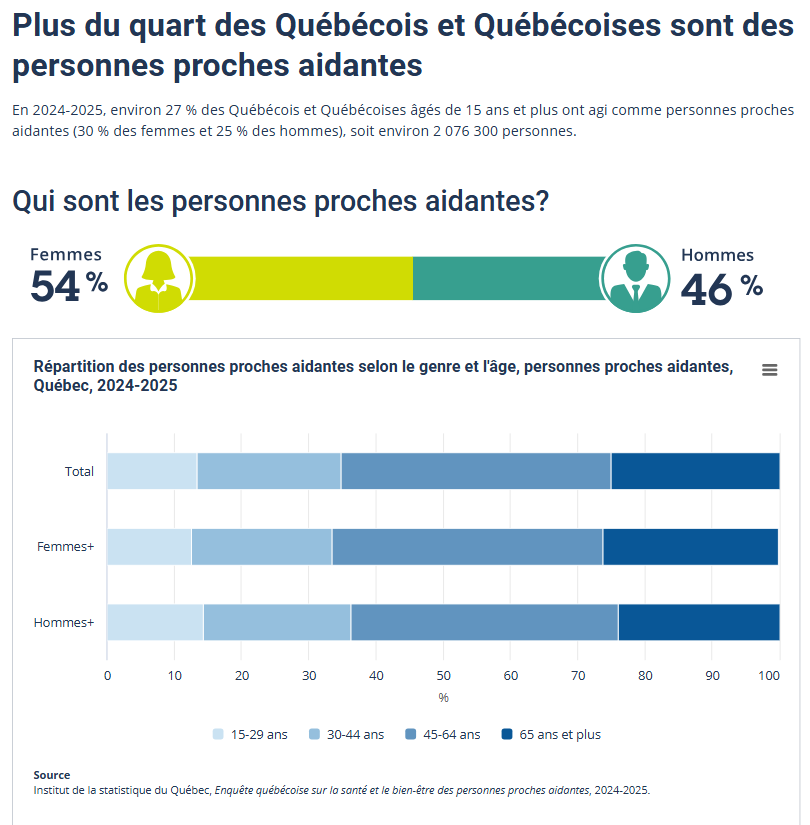
In Québec, 27% of people aged 15 and over are informal caregivers, or about 2,076,300 people.
Data on the evolution of the Québec population and its age and gender structure, as well as on the components of demographic growth. Some comparisons are made with Canada and the other provinces.
Environ 7 % des personnes âgées de 65 ans et plus vivant à domicile ont vécu de la maltraitance en 2025. Il s’agit d’une hausse en comparaison de la proportion estimée en 2019 (6 %).
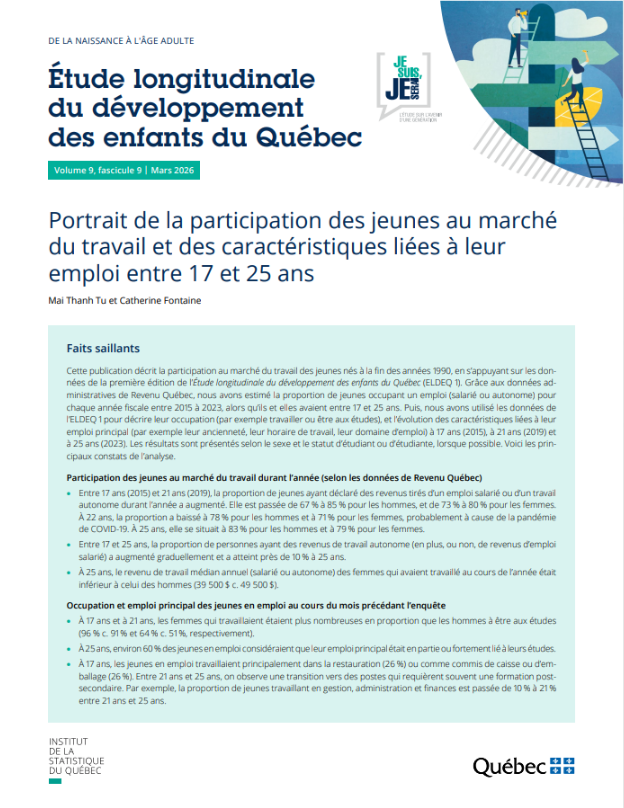
New analysis: Bien-être au travail à 25 ans : associations avec les facteurs personnels et professionnels (in French only)
A statistical portrait of prejudice towards poverty and people living in poverty, from the perspective of both the general population and those affected.
This initiative is based on the Cadre de mesure du progrès pour le Québec [framework for measuring progress in Québec] and aims to examine these inequalities in light of a wide range of indicators on the population’s current and future well-being.
Statistical data and analyses on the demographic situation in Québec: population changes, age structure, births, deaths, migration.