Data on population projections in Québec up to 2071.
Data on the evolution of the Québec population and its age and gender structure, as well as on the components of demographic growth. Some comparisons are made with Canada and the other provinces.
Data on projections about the number of private households, from 2021 to 2071.
Data on population projections according to the administrative regions and metropolitan areas geographical level, up to 2051.
Data on projections about the number of private households.
The showcase features indicators related to demographics, material living conditions, work, retirement, lifestyle, health and well-being, and the social participation of seniors.
De quelle façon la proportion de jeunes ayant un excès de poids a-t-elle évolué durant l’adolescence et au début de l’âge adulte?
Main results presented in a summary dashboard. Detailed information is also provided for each indicator. Update: Taux de faible revenu selon la Mesure du panier de consommation; Anomalies de température; Dépassements de la concentration de particules fines dans l’air.
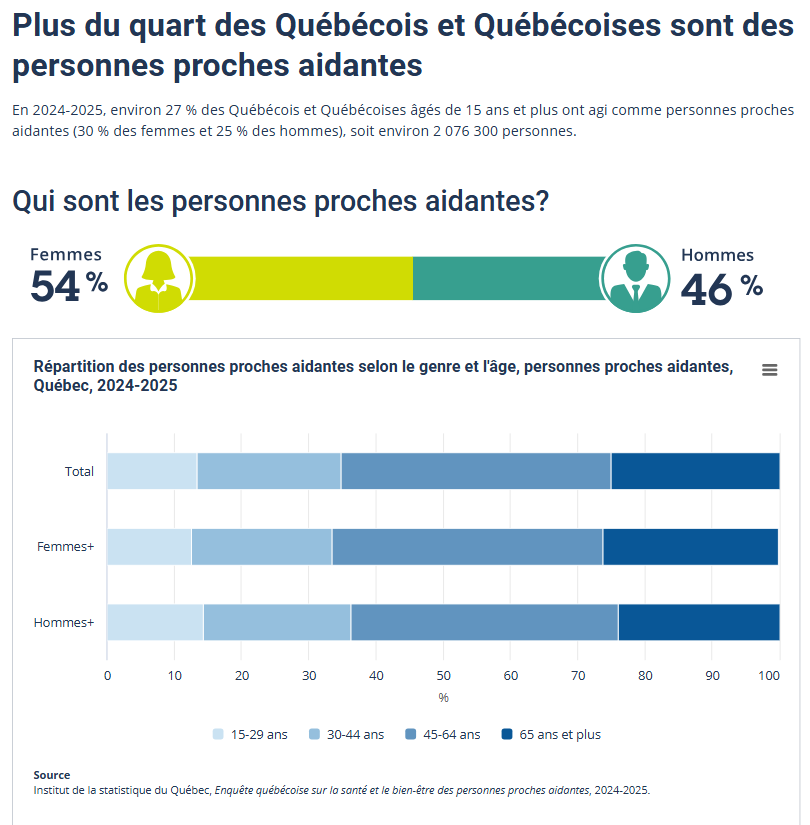
In Québec, 27% of people aged 15 and over are informal caregivers, or about 2,076,300 people.
Significant progress has been made in the past few years but inequalities remain. The showcase provides the most up-to-date picture possible of the situation.