Survey of Consumer Finances (SCF) (Statistics Canada website)
These statistics are provided according to three types of income (market income, total income, and after-tax income) and are broken down by various socio-demographic characteristics of households and individuals.
These tables contain two measures of income inequality among households and individuals: income quintiles and the Gini coefficient. These statistics are presented according to three types of income: market income, total income, and after-tax income.
These statistics focus on low household and individual income as defined by the Low Income Measure (LIM), as well as on low family unit and individual income as defined by the Market Basket Measure (MBM).
A new version of the Gini coefficient is added to the collection of tables on household and individual income inequality: a coefficient based on adjusted income, which takes into account household size.
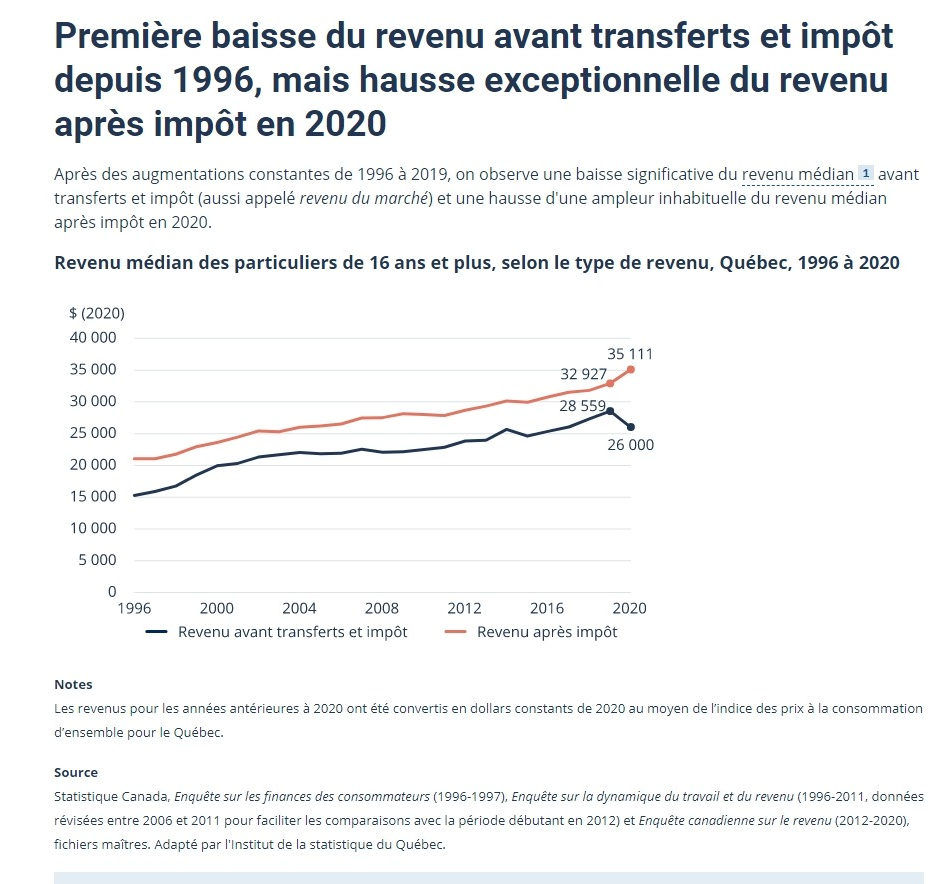
First drop in income before transfers and taxes since 1996, but exceptional increase in after-tax income in 2020
In 2019, the median after-tax income in Quebec was $32,700 for individuals and $59,800 for households. By comparison, in 1996, it was $20,900 for individuals and $42,800 for households.