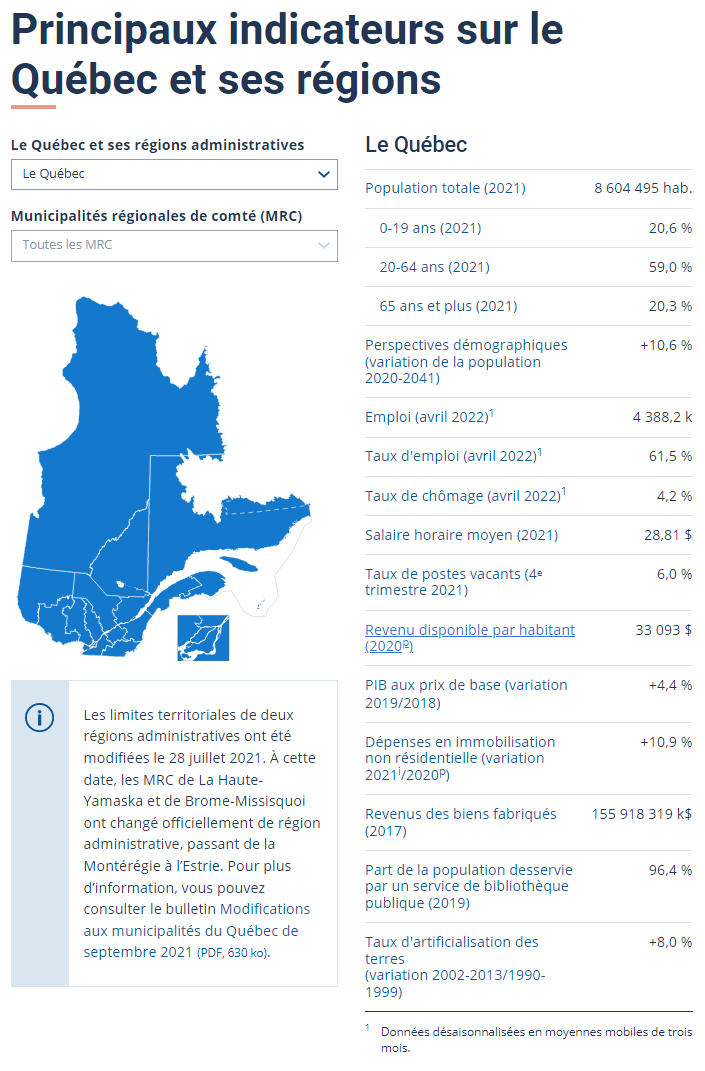
Economic, demographic, cultural and environmental indicators for all of Québec, its administrative regions and their RCMs. Latest update: Employment, Employment rate, Unemployment rate
Data on the evolution of the Québec population and its age and gender structure, as well as on the components of demographic growth. Some comparisons are made with Canada and the other provinces.
Main results presented in a summary dashboard. Detailed information is also provided for each indicator. Update: Taux de faible revenu selon la Mesure du panier de consommation; Anomalies de température; Dépassements de la concentration de particules fines dans l’air.
Statistical data and analyses on the demographic situation in Québec: population changes, age structure, births, deaths, migration.
Overview of the demographic report as of July 1, 2025 for Québec’s 17 administrative regions: population changes, age structure, births, deaths, migrations.
Annual population estimates for Québec’s municipalities as of July 1 by age group and gender. Data available from 2001.
Annual population estimates for Québec’s CMAs as of July 1 by age and gender. 2021 CMA geographic boundaries. Data available from 2001.
Annual population estimates for Québec’s administrative regions as of July 1. Data available from 1986 (total population) or 1996 (population by age and gender).
Annual population estimates for Québec’s RCMs as of July 1 by age and gender. Data available from 1996.
Published annually, the Panorama des régions du Québec draws a socioeconomic portrait of the 17 administrative regions and the regional county municipalities (RCMs) that comprise them.