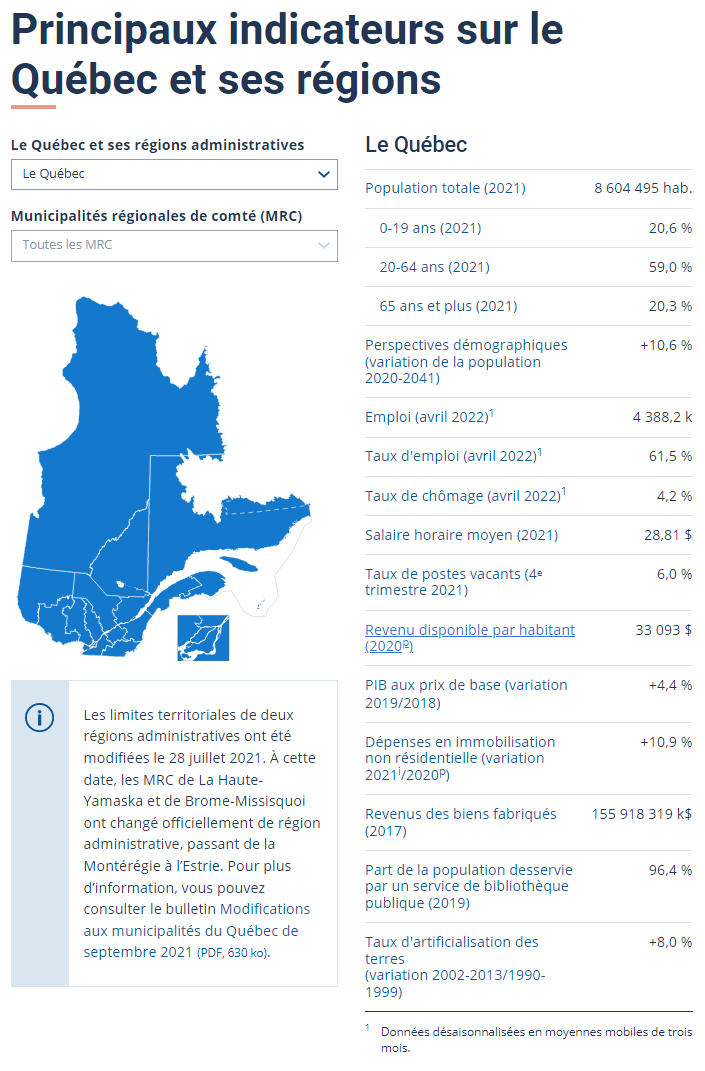
Economic, demographic, cultural and environmental indicators for all of Québec, its administrative regions and their RCMs. Latest update: Employment, Employment rate, Unemployment rate
Tables on non-residential tangible capital expenditures in Québec by asset, industry, ownership and country of control; intangible and residential construction.
In 2024, residential construction expenditures were estimated at $36.6 billion, up 14.8% from 2023. They were mainly for renovations (61.0%).
Tables on non-residential tangible capital expenditures by region according to asset, industry, ownership and country of control; intangible and residential construction.
Tables on non-residential tangible capital expenditures by CMAs according to asset, industry, ownership and country of control; intangible and residential construction.
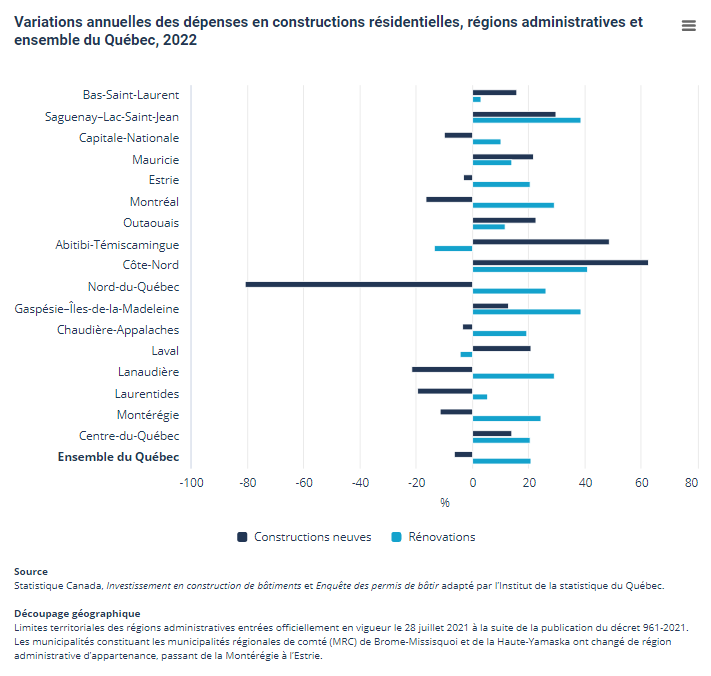
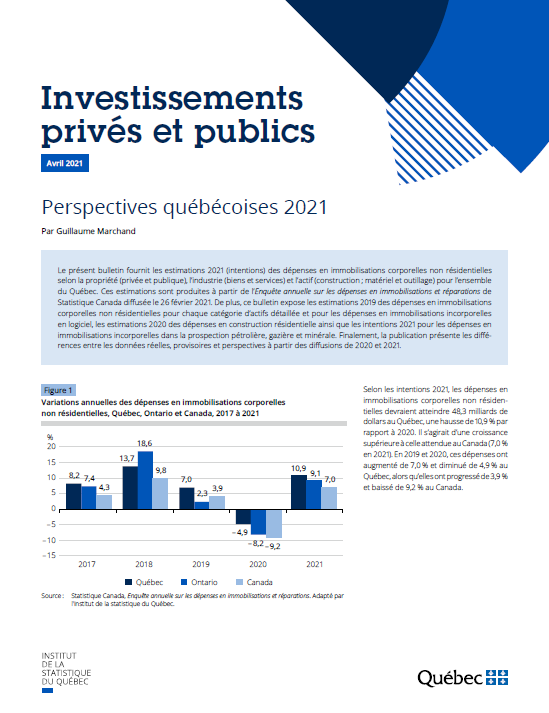
Analysis of recent changes in capital expenditures in Québec administrative regions and census metropolitan areas.
In 2021, business enterprise research and development spending totalled $6,569 million, an increase of 7.4% from 2020 and 15.1% from 2019.