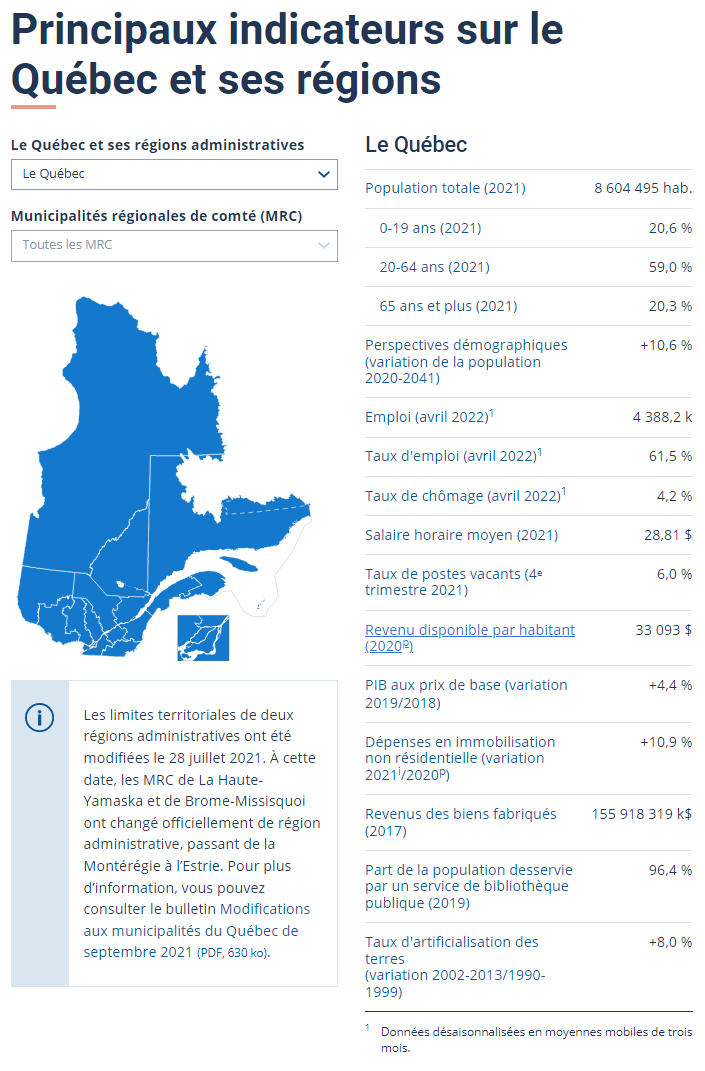
Discover the main economic, demographic, cultural and environmental indicators for this region and its regional county municipalities (RCM).
Dynamic graphs present statistics on performing arts, visual arts, libraries, film, sound recordings, museum institutions, cultural professions, cultural spending, etc.
Monthly and annual new book sales by different types of establishments and variations in new book sales.
Tableaux sur la fréquentation scolaire et la situation sur le marché du travail des jeunes de 15 à 29 ans ainsi que sur l’évolution de la proportion de jeunes ni en emploi, ni aux études, ni en formation.
The monthly publication Résultats de l’Enquête sur la population active pour le Québec presents the labour market conditions in Québec using data disseminated by Statistics Canada.
Economic, demographic, cultural and environmental indicators for all of Québec, its administrative regions and their RCMs. Latest update: Employment, Employment rate, Unemployment rate
Labour force, employment and unemployment data, as well as participation, employment and unemployment rates.
In 2025, residential construction expenditures were estimated at $39.8 billion, up 17.5% from 2024. They were mainly for renovations (51.8%).
Tables on non-residential tangible capital expenditures by region according to asset, industry, ownership and country of control; intangible and residential construction.
Le Québec chiffres en main is a conveniently-sized booklet containing statistical tables and figures for anyone looking for information about Québec and its regions.