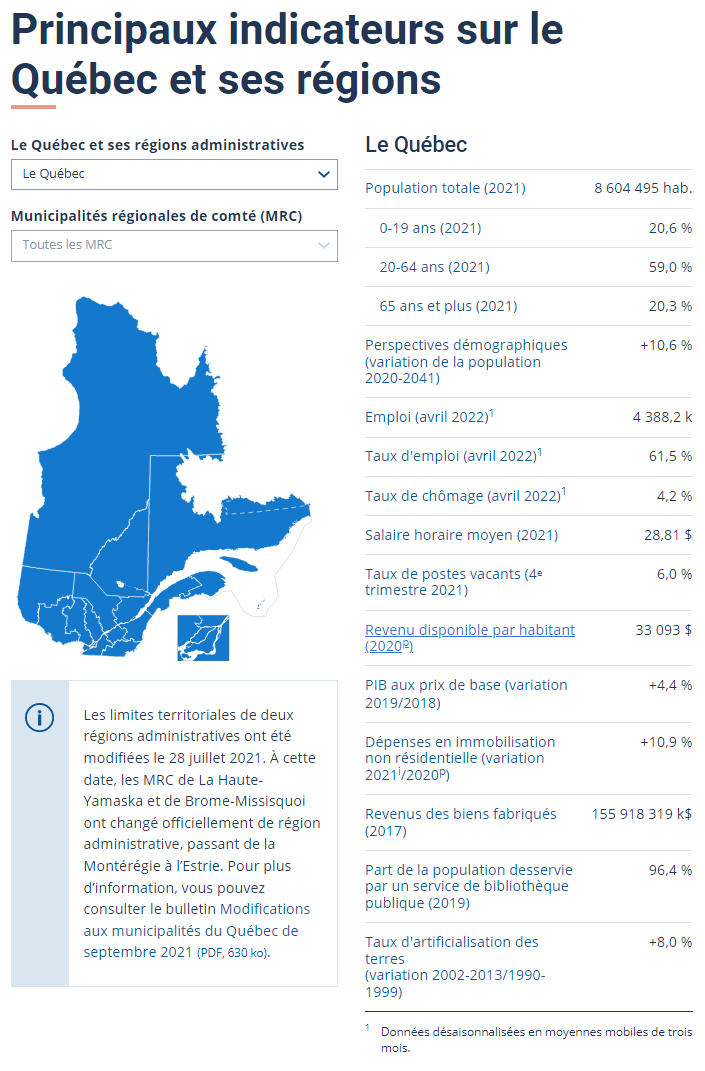
The Optique culture bulletin analyzes statistics on sales of various cultural products, on attendance at cultural places, on household and government expenditure in culture, on cultural institutions and workers, on the economy of culture, etc.
Top films presented in movie theatres ranked according to screenings, attendance or revenues, by year, for all films, Québec films and 3D films.
Table on the number of active movie theatres and drive-ins, as well as the number of screens and seats by region and type of business (large chains, small chains or independents).
Table on the distribution of movie theatres and drive-ins by number of screens.
Annual, monthly and weekly results (screenings, attendance and revenues), 1985 to 2022.
Table on the annual results (screenings, attendance and revenues) of movie theatres and drive-ins by film classification category.
Table on annual results (screenings, attendance and revenues) of movie theatres and drive-ins according to screening language.
Table presenting a series of indicators on cinemas: screenings, attendance, revenues, average admission price, available seats and occupancy rate.