Notice of release
Québec, May 30, 2022. – Despite the decline in economic activity caused by the health crisis, per capita disposable income increased by 8.2% in 2020 in Québec. This was the strongest growth in current dollars since 1984. This sharp increase in disposable income was mostly due to the various support measures put in place by the federal government in response to the COVID-19 crisis, which more than offset the decline in labour income. This finding comes from the publication Bulletin sur le revenu disponible released today by the Institut de la statistique du Québec.
Disposable income up by more than 6.0% in all regions
In 2020, per capita disposable income rose significantly in all 17 of Québec’s administrative regions, propelled by an unprecedented increase in government transfers. The strongest increases were recorded in the regions of Nord-du-Québec (+9.5%) and Laval (+9.0%).
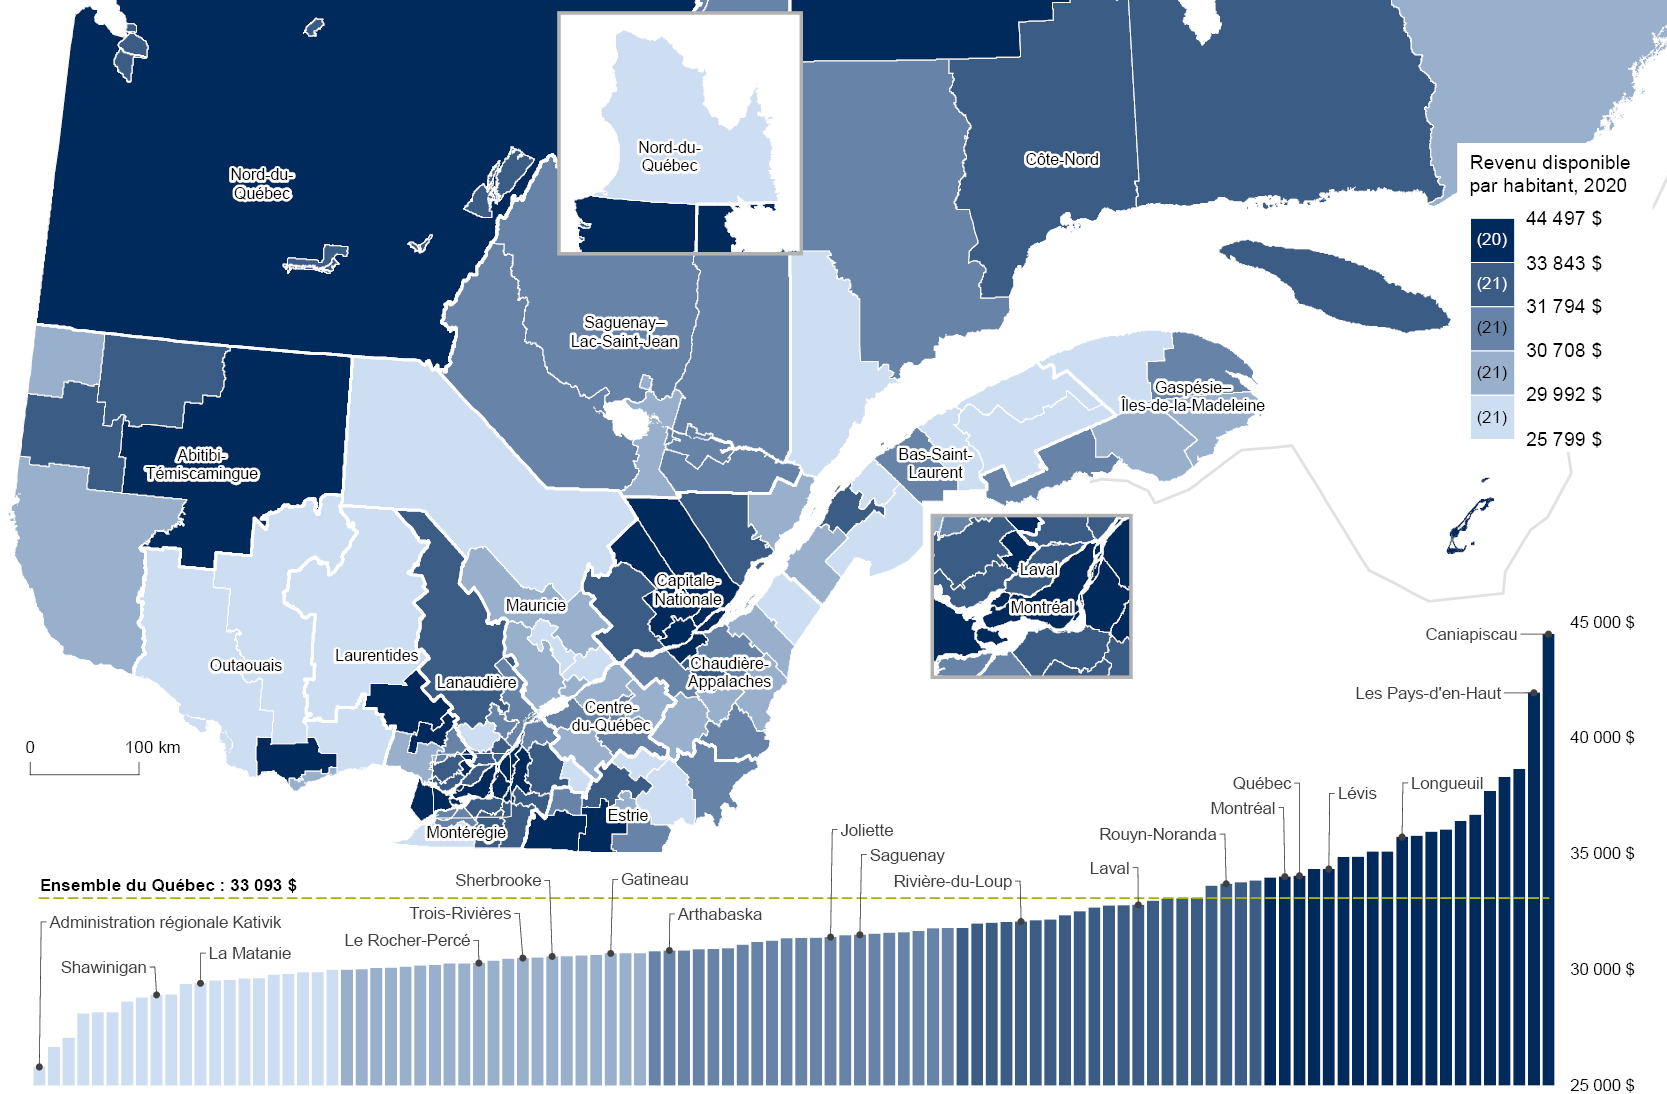
According to preliminary data for 2020, Montérégie ($34,369) had the highest per capita disposable income in Québec. It was immediately followed by the Capitale-Nationale ($34,196) and Montréal ($34,019) regions. In contrast, the Mauricie region ($29,892) had the lowest per capita disposable income.
Unprecedented growth in government transfers
Current transfers received from governments, which represent the second largest source of income for individuals, increased in Québec as a whole by 38.1% in 2020 to $9,604 per capita. This exceptional growth was mainly due to the various support measures introduced in 2020 by the Canadian government to mitigate the economic consequences of the health crisis. The main measures were, in order of importance, the Canada Emergency Response Benefit (CERB), the Canada Recovery Benefit (CRB), and the Canada Emergency Student Benefit (CESB).
On a regional level, the areas that registered the strongest growth in government transfers per capita were Montréal (+49.3%) and the four adjacent regions, namely Laval (+50.4%), Laurentides (+40.5%), Montérégie (+38.4%), and Lanaudière (+37.1%). In general, a greater proportion of workers in these regions appear to have used the income support measures such as the CERB and CRB, and for longer than workers in the rest of Québec.
Portrait of regional county municipalities (RCMs)
At the RCM level, the largest increases in per capita disposable income in 2020 were observed in the territories of the Kativik Regional Government (+12.7%) in the Nord-du-Québec region, in the Robert-Cliche RCM (+11.9%) in Chaudière-Appalaches, in the Jardins-de-Napierville RCM (+11.8%) in Montérégie, and in the Pays-d’en-Haut RCM (+11,8 %) in the Laurentides region.
The Caniapiscau RCM ($44,497) in Côte-Nord, whose economy is largely based on the mining industry, had the highest disposable income. The RCMs located on the outskirts of Montréal and those around Québec City also did well, and their per capita disposable income was generally higher than the provincial average. This was the case for La Vallée-du-Richelieu ($37,711) on Montréal’s South Shore, and La Jacques-Cartier ($38,324) in the suburbs of Québec City.
Per capita disposable income, Québec RCMs, 2020 (map in French only)

Note
According to the new administrative region boundaries that came into effect on July 28, 2021, following the publication of Order in Council 961-2021. On that date, the La Haute-Yamaska and Brome-Missisquoi RCMs changed their administrative region from Montérégie to Estrie.
Sources
Data on disposable income:
Institut de la statistique du Québec, Ministère des Affaires municipales et de l’Habitation, Ministère de l’Enseignement supérieur, Cree Hunters and Trappers Income Security Board, Retraite Québec, Revenu Québec, Indigenous Services Canada, Société de l’assurance automobile du Québec, Société d’habitation du Québec, and Statistics Canada.
Data on administrative boundaries:
Ministère de l’Énergie et des Ressources naturelles, Système sur les découpages administratifs.
What is per capita disposable income?
To obtain per capita disposable income, the income of all the residents of a given area, such as labour income, net income of unincorporated business, net property income and social benefits, is first added up. Then, current transfers paid by these residents to other institutional sectors, including personal income taxes, contributions to social insurance plans and contributions to defined benefit and defined contribution pension plans, are subtracted. Lastly, the result is divided by the total population in the area. Therefore, disposable income is the amount available to individuals for final consumption of goods and services and for voluntary savings.
For more informations
Read the publication (PDF, 1.69 MB)
View the dynamic statistical tables
The Institut de la statistique du Québec produces, analyzes and disseminates official, objective and quality statistical information on various aspects of Québec society. It is responsible for conducting all statistical surveys of general interest. The relevance of its work makes it a strategic ally for decision makers and all those wishing to learn more about Québec.
