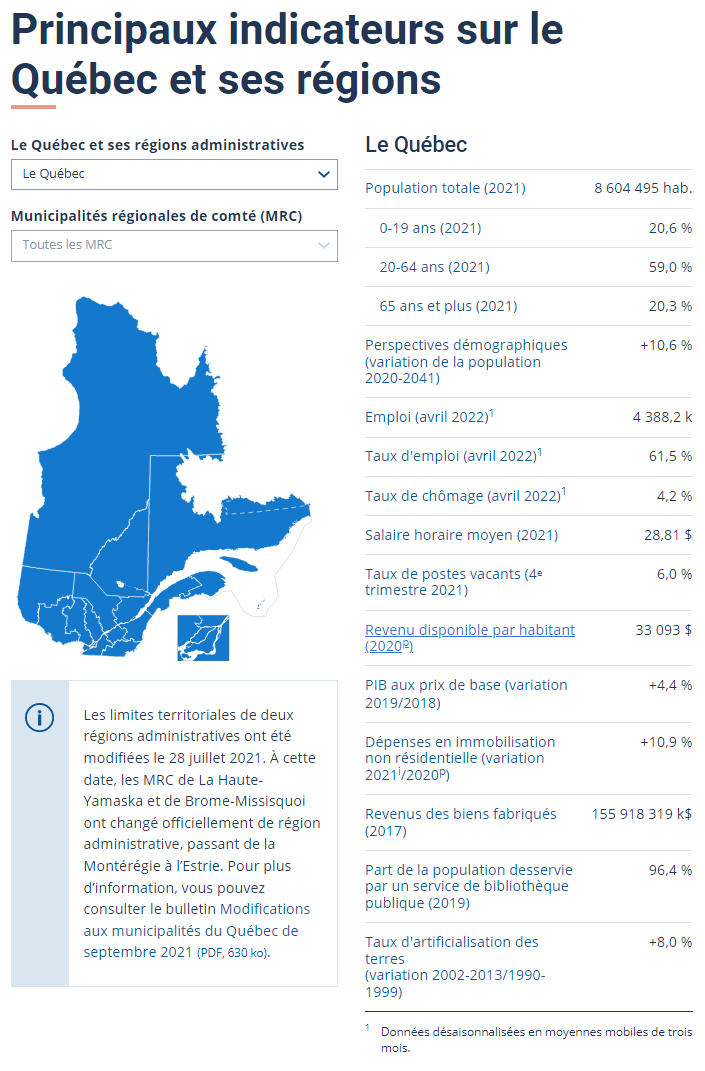
Economic, demographic, cultural and environmental indicators for all of Québec, its administrative regions and their RCMs. Latest update: Employment, Employment rate, Unemployment rate
Tables detailing revenues and expenses of multidisciplinary broadcasters supported by the Conseil des arts et des lettres du Québec.
Table detailing the revenues and expenses of specialized broadcasters supported by the CALQ
Tables on revenues, expenses and activities of dance production organizations supported by the Conseil des arts et des lettres du Québec.
Tables on revenues, expenses and activities of music production organizations, by administrative region and according to revenue size.
Table on revenues, expenses and activities of theatre and circus arts production organizations supported by the CALQ
Statistics starting in 2017-2018
Statistics on the revenues and expenditures of cultural periodical publishers supported by the Conseil des arts et des lettres du Québec, as well as the number of publishers supported, the number of publications...
Volume of e-ebook books sold by Québec establishments each month and each year. Latest data added: September to October 2025