
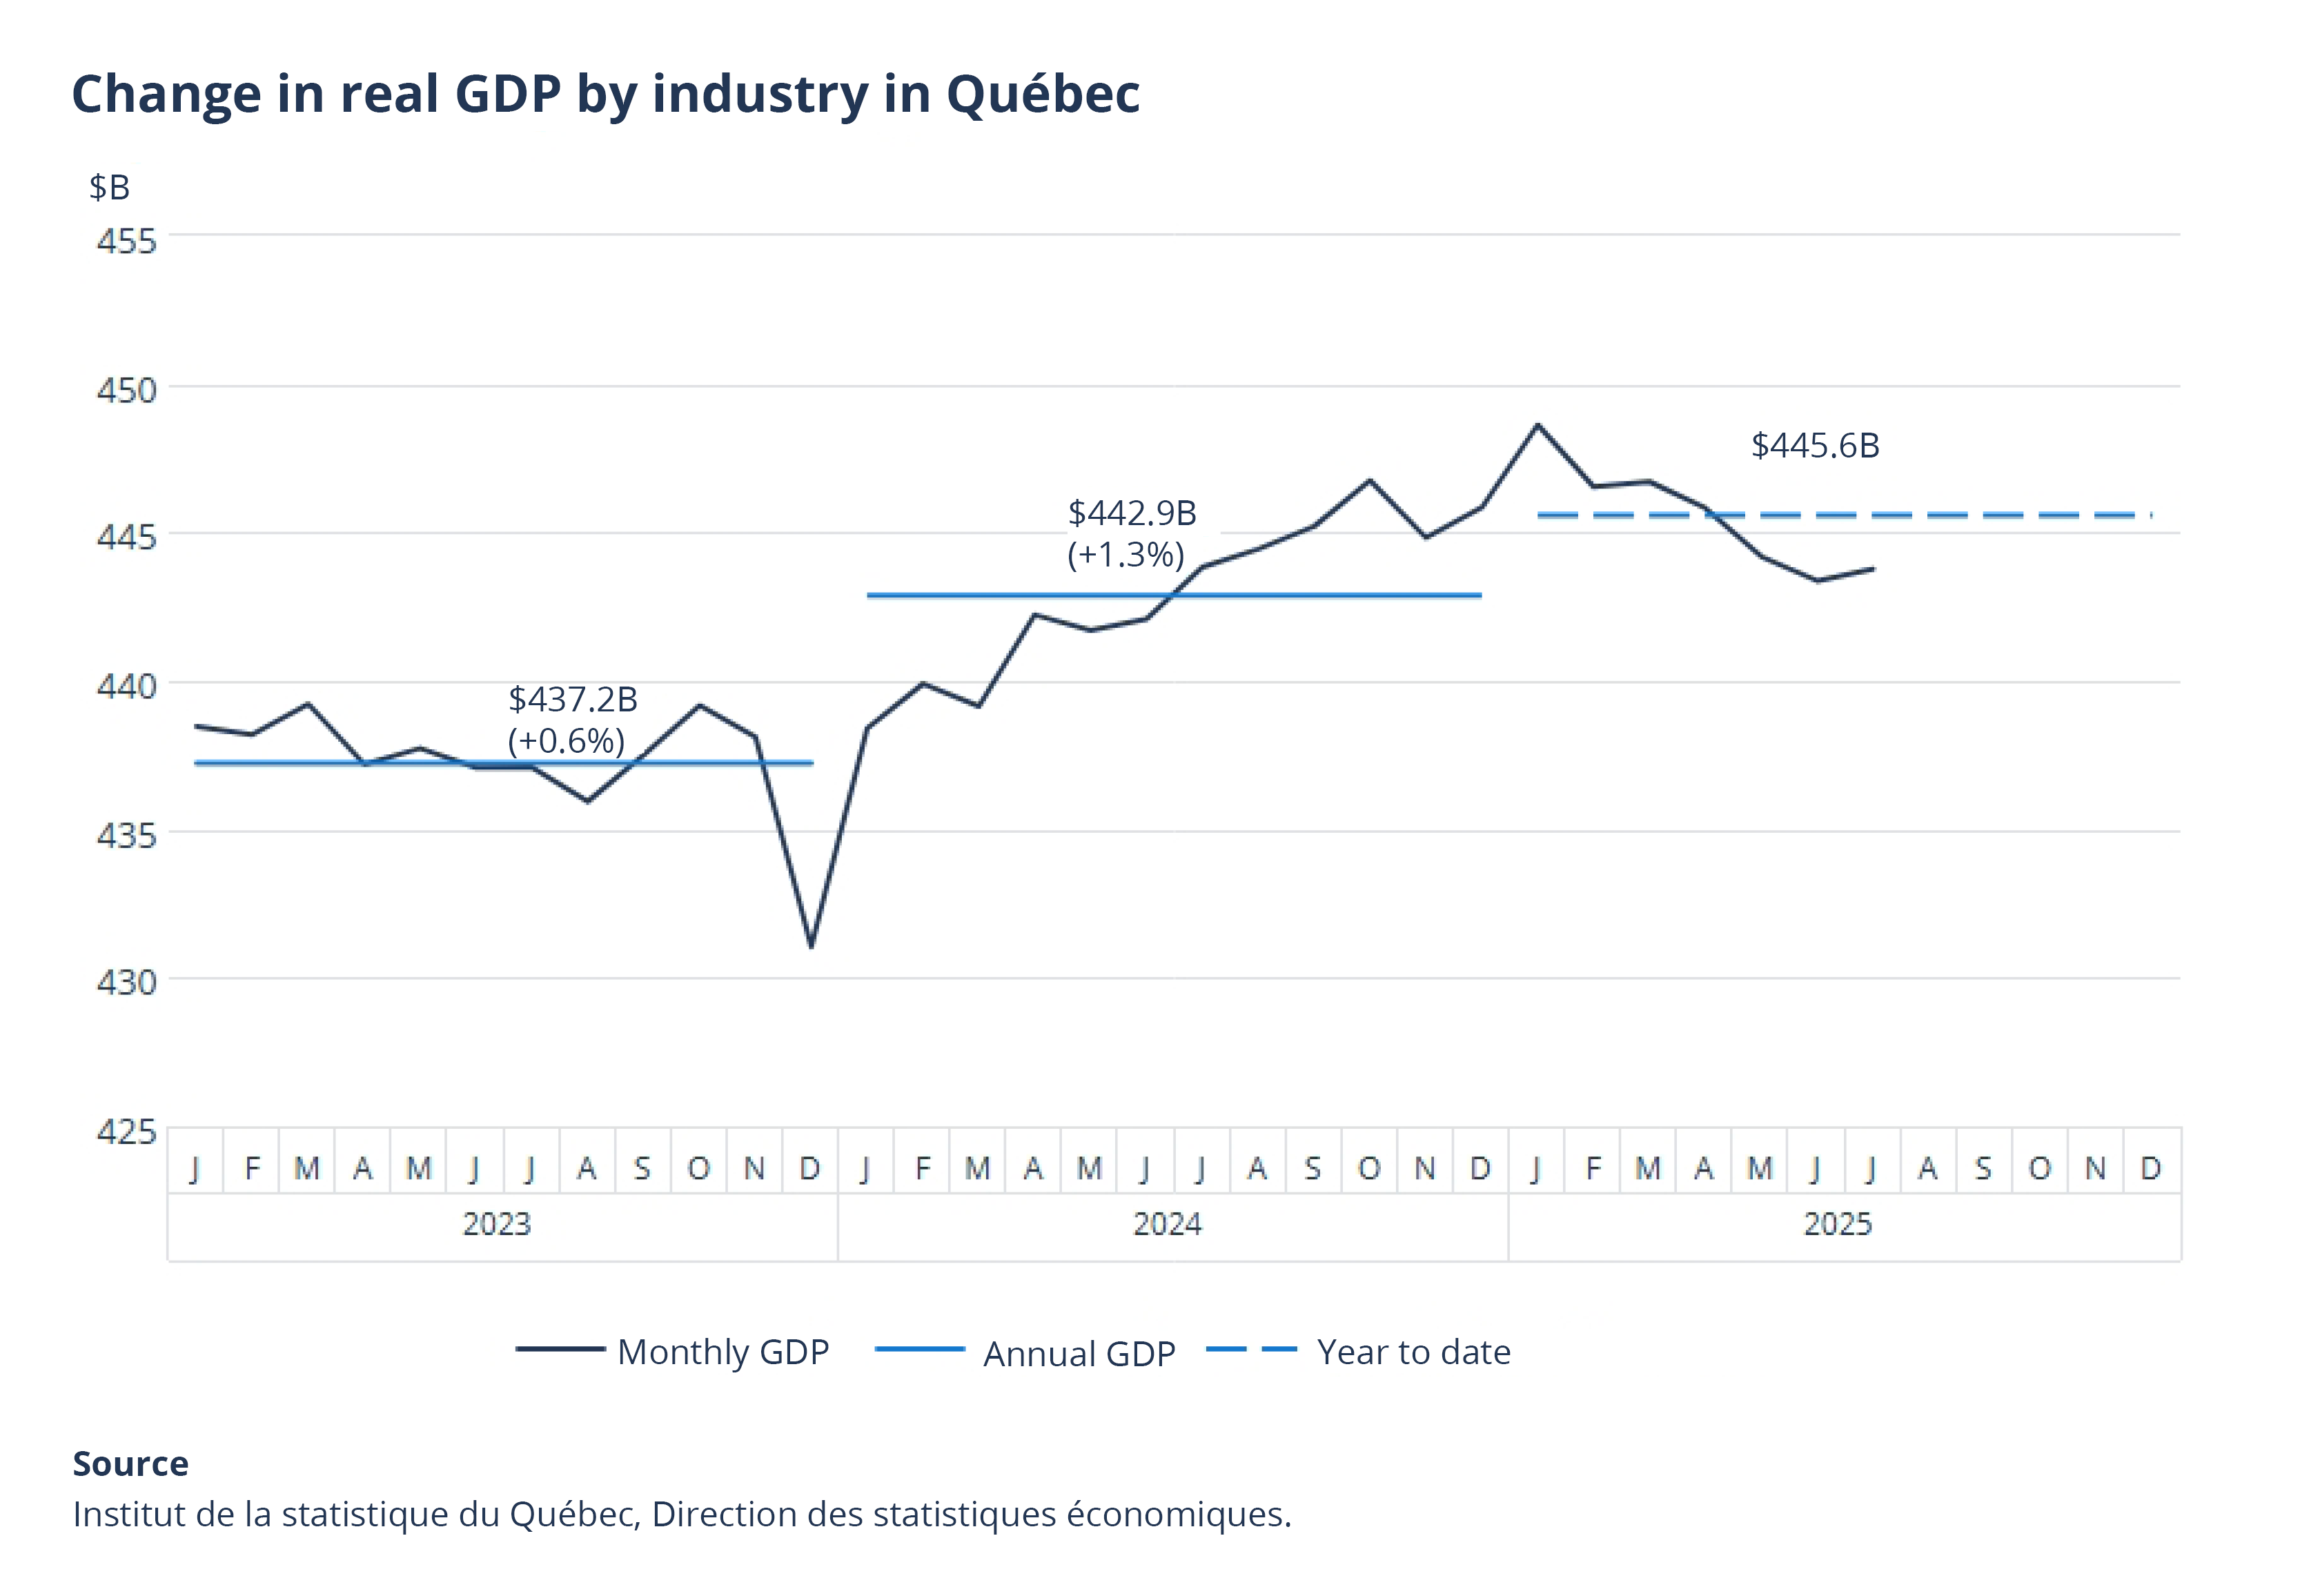
Québec, October 28, 2025. – In July 2025, Québec’s real gross domestic product (GDP) at basic prices was up 0.1% from the previous month after a 0.2% decrease in June. This was revealed in Produit intérieur brut par industrie au Québec, juillet 2025 released today by the Institut de la statistique du Québec.
Production of goods up 0.8%
Output in the goods-producing industries was up 0.8% in July, after decreasing 1.1% in June. This increase came mainly from mining, quarrying, and oil and gas extraction (+9.2%) and, to a lesser extent, from utilities (+2.8%) and construction (+0.8%).
Service production down 0.1%
Output in the service-producing industries decreased by 0.1% in July following a 0.1% increase in June. The drop in July was mainly due to wholesale trade (-1.6%). Professional, scientific and technical services (-0.4%), arts, entertainment and recreation (-2.7%) and health care and social assistance (-0.2%) also contributed to the decline, but to a lesser degree. In contrast, educational services (+0.9%) and transportation and warehousing (+1.0%) both posted increases.
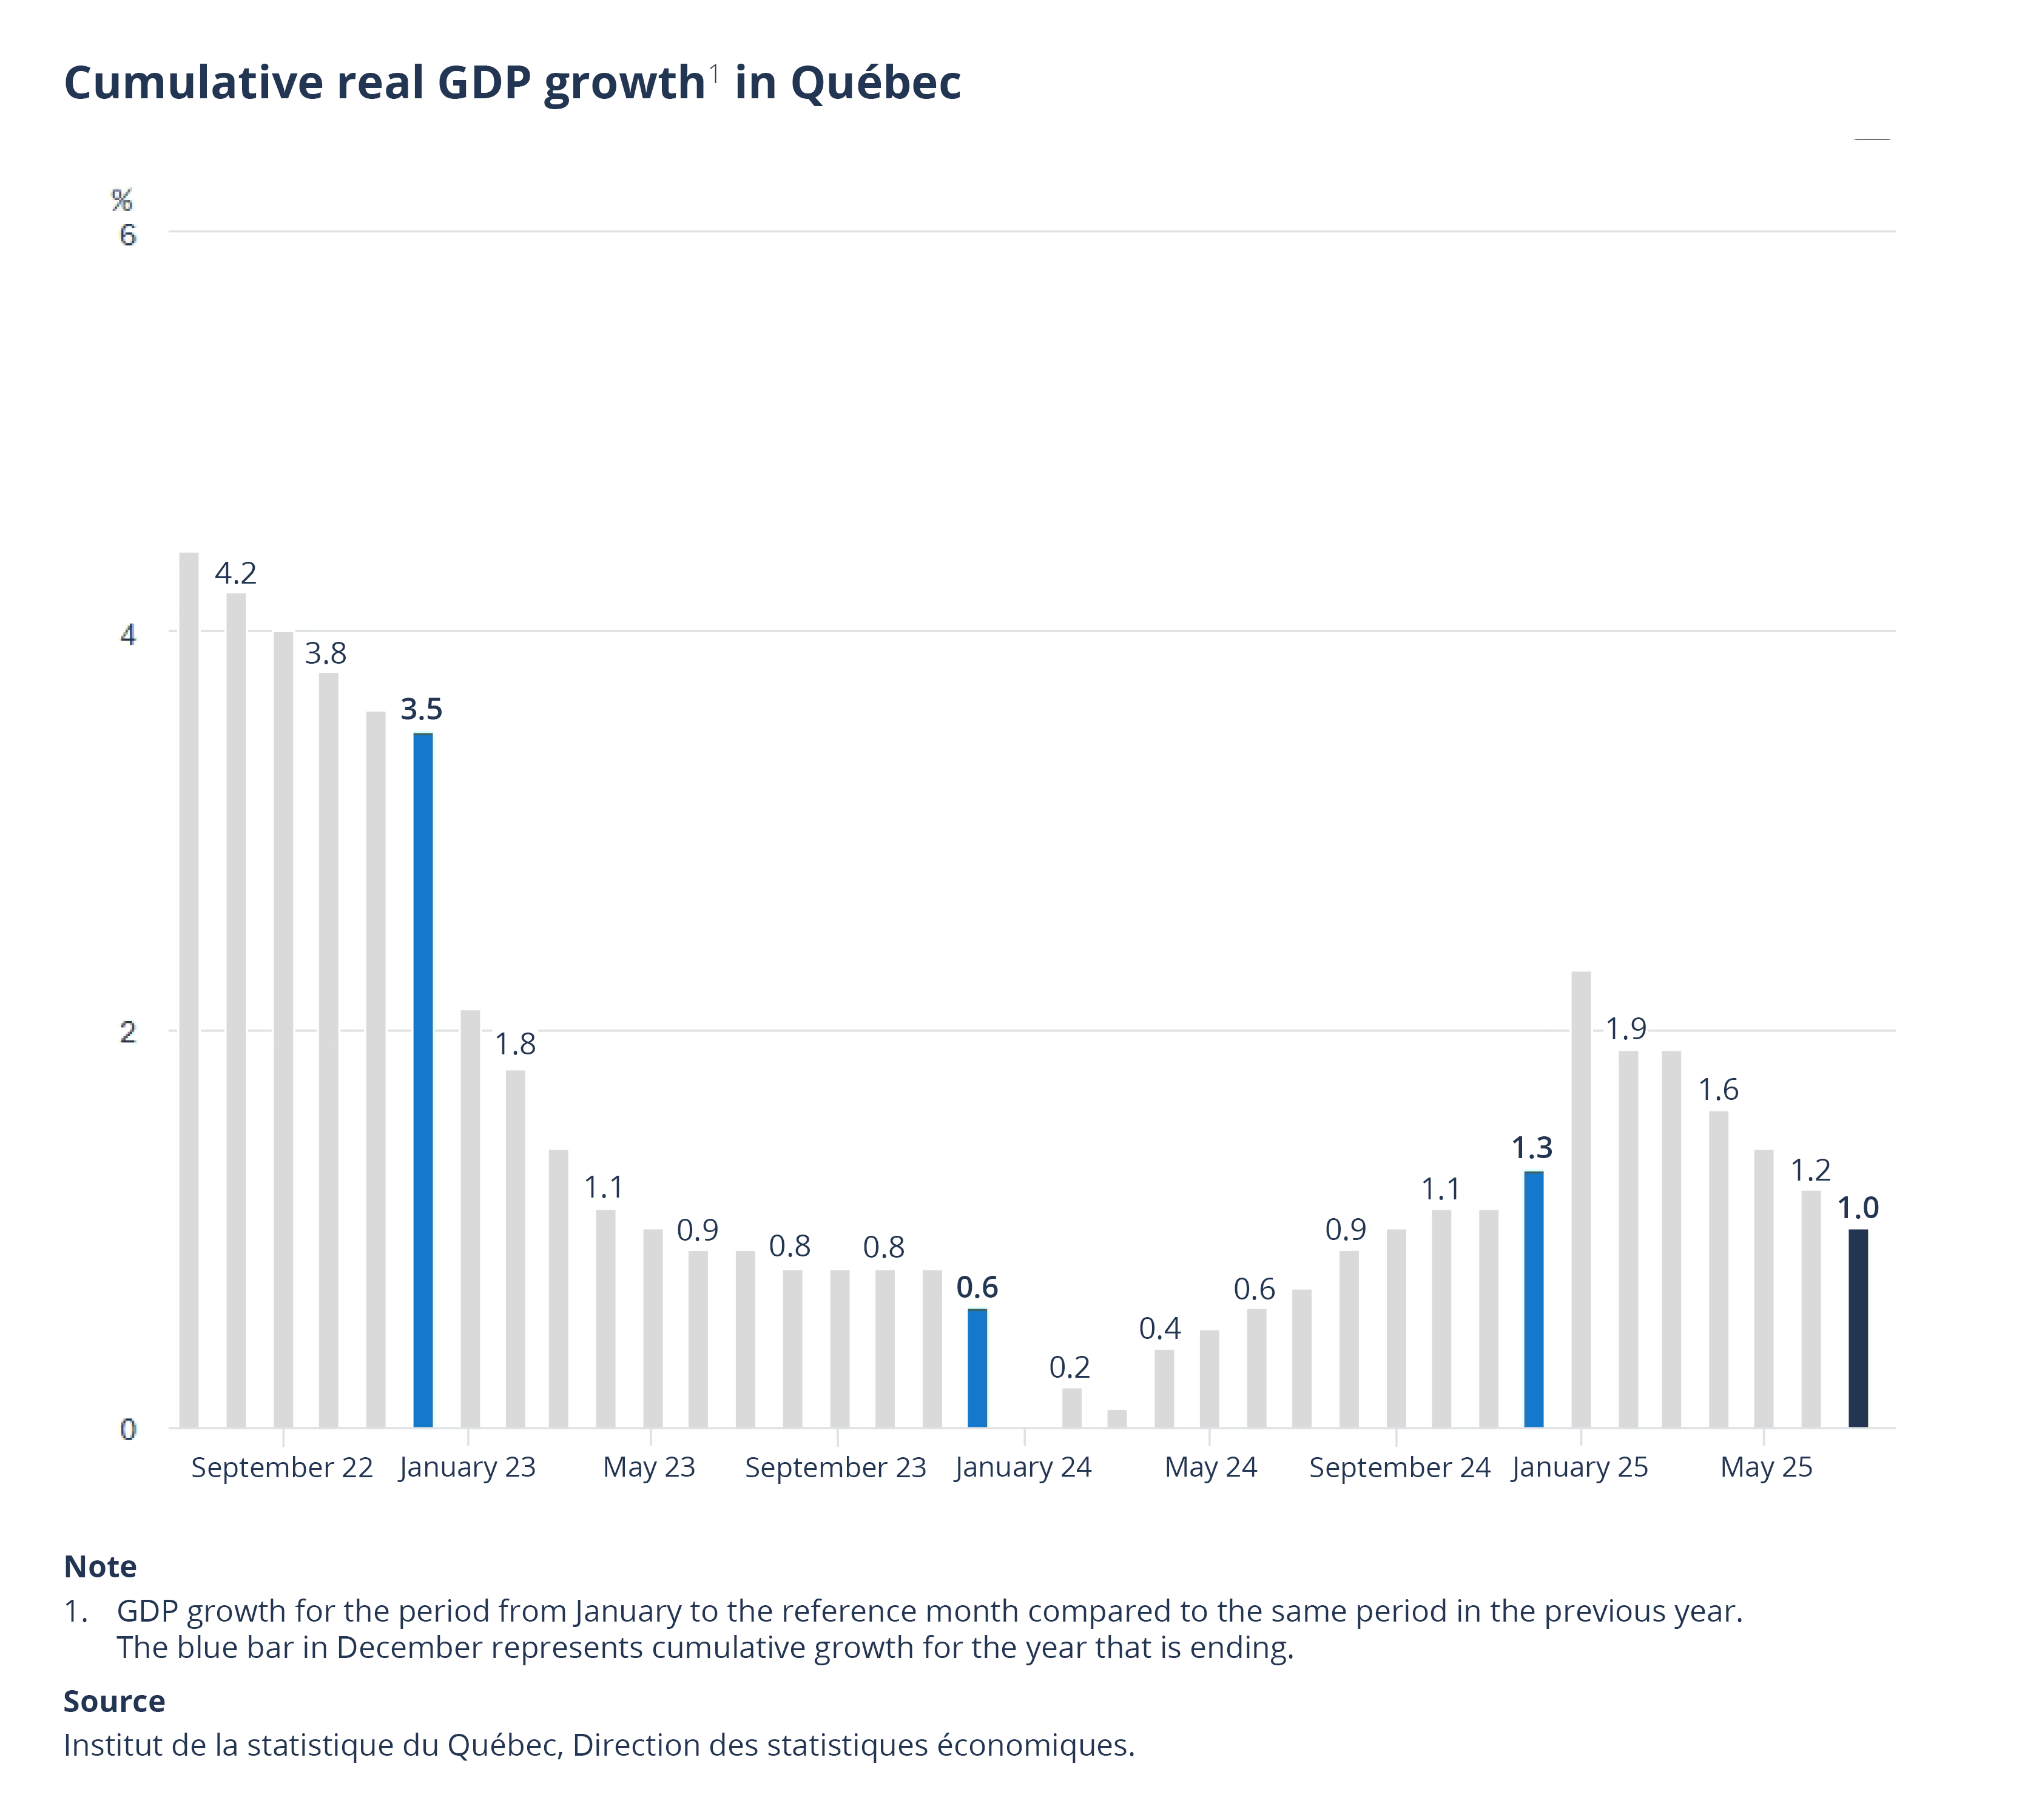
Cumulative total for the first seven months of 2025: Québec’s real GDP up 1.0%
For the first seven months of 2025, Québec’s real GDP was 1.0% higher than in the same months of 2024. The sectors that contributed the most to this increase are educational services (+4.8%), real estate and rental and leasing (+1.9%), retail trade (+3.4%), health care and social assistance (+2.0%), and finance and insurance (+2.7%). Conversely, manufacturing was down 2.0%.
Canada’s real GDP at basic prices up 0.2% in July 2025
According to data published by Statistics Canada on September 26, 2025, Canada’s real GDP at basic prices was up 0.2% in July following a 0.1% decrease in June. Output in the goods-producing industries increased by 0.6% while that in the service-producing industries rose by 0.1%. For the first seven months of 2025, Canada’s real GDP was 1.4% higher than in the same months of 2024.
| Real gross domestic product by industry1 (percentage change) |
||||
|---|---|---|---|---|
| 2024 | 2025 | |||
| Annual change | Monthly change | Cumulative change2 | ||
| June | July | |||
| Québec | 1.3 | −0.2 | 0.1 | 1.0 |
| Canada | 1.7 | −0.1 | 0.2 | 1.4 |
|
1. Gross domestic product levels by industry are valued at basic prices in chained dollars (2017), seasonally adjusted and annualized. Sources |
||||
The Institut de la statistique du Québec produces, analyzes and disseminates official, objective and quality statistical information on various aspects of Québec society. It is responsible for conducting all statistical surveys of general interest. The relevance of its work makes it a strategic ally for decision makers and an essential source of information for all those wishing to learn more about Québec.