
Québec, November 2, 2026. – The Institut de la statistique du Québec published today the Panorama des régions du Québec (PDF), which provides a portrait of the 17 administrative regions according to nine themes: demography, the labour market, GDP, per capita disposable income, property values, tourist accommodations, proximity to urban green spaces, health, and electric transportation. A chapter is dedicated to regional county municipalities (RCMs).
The share of people aged 65 and over exceeds that of youth under 20 years of age in 11 regions
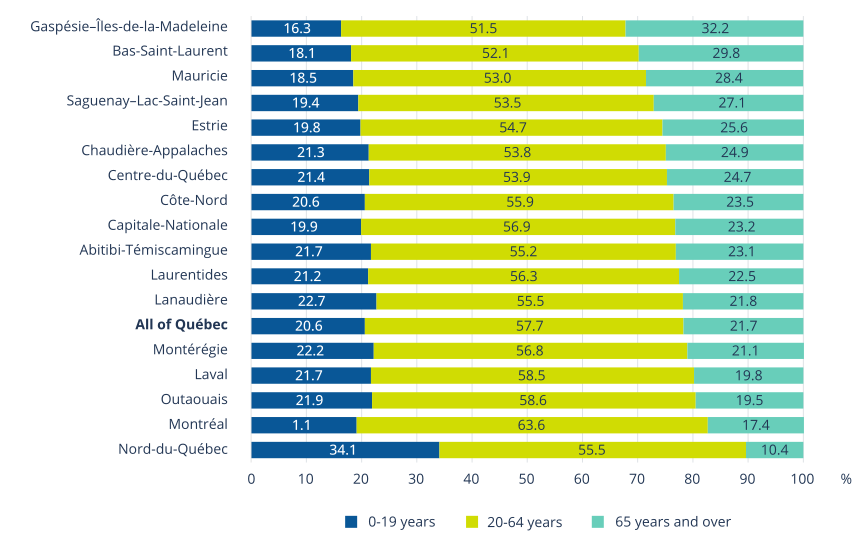
Although population aging is observed in all regions, it is more pronounced in some of them, including Gaspésie–Îles-de-la-Madeleine where the proportion of people aged 65 and over (32%) is one of the highest in Canada. Bas-Saint-Laurent, Mauricie and Saguenay–Lac-Saint-Jean are also among the regions with older populations.
Distribution of the population by age group, administrative regions and all of Québec, 2025
Notes
Based on the geographic boundaries of administrative regions on July 1, 2025.
Preliminary data.
Sources
Institut de la statistique du Québec.
Statistics Canada, Annual Demographic Estimates (Subprovincial Areas, January 2026). Adapted by the Institut de la statistique du Québec.
An increasing number of older people are employed
In addition to accounting for a growing share of the Québec workforce, people aged 55 to 64 are more likely to be employed than before—their employment rate rose by more than 12 percentage points between 2011 and 2025 to approximately 64%. This increase is observed in most administrative regions, especially Chaudière-Appalaches (about +18 points) and Saguenay–Lac-Saint-Jean (about +17 points).
Job vacancies halved in just three years
Between 2022 and 2025, the number of job vacancies in Québec dropped by 50%. There were declines in almost every region, including Outaouais where vacancies were down by 60%. Large decreases were also recorded in the regions of Laurentides (-59%), Capitale-Nationale (-58%), and Montréal (-54%).
Economic indicators are positive in almost all regions
While GDP increased in every region and growth in per capita disposable income accelerated in almost all of them in 2024, there were differences in regional performances. The regions of Côte-Nord and Centre-du-Québec recorded the strongest GDP growth rates in 2024. Disposable income also grew faster in those two regions than in Québec as a whole.
In contrast, Nord-du-Québec had the lowest GDP growth rate in the province. Nevertheless, its GDP per capita remains the highest of all regions at $143,145, more than double the provincial average.
The value of single-family homes surged in Estrie and around large urban centres
Over the past ten years, the average property value of single-family homes in Québec has risen from $264,000 to $499,000, up by 89%. During that period, regions where population density increased rapidly generally saw more growth in property values. This is the case for Estrie, Laurentides and Lanaudière, where the average value of single-family homes has more than doubled.
Registration rate for primary health and social services varies by region
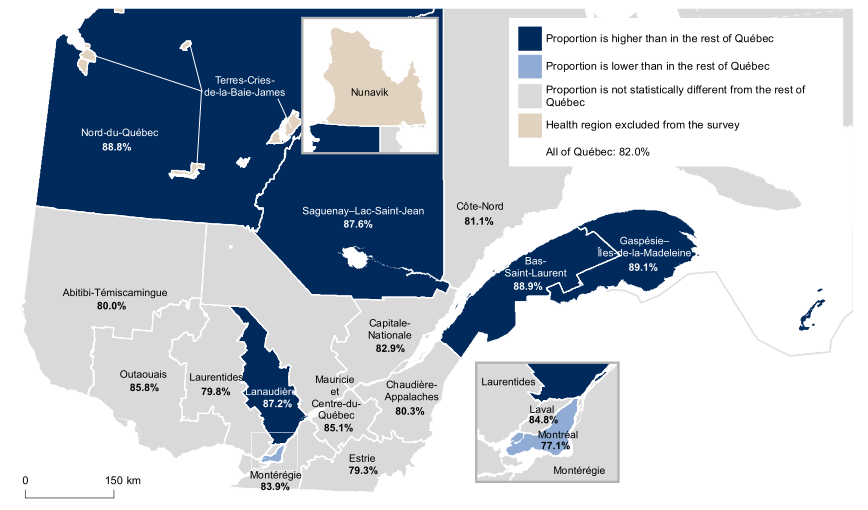
About 82% of the Québec population aged 18 and over is registered with a primary care provider (family doctor, group of doctors, or specialized nurse practitioner). This proportion is lower in Montréal than in the rest of the province. In contrast, it is higher in Lanaudière, Bas-Saint-Laurent, Saguenay–Lac-Saint-Jean, Nord-du-Québec, and Gaspésie–Îles-de-la-Madeleine.
Share of the population registered with a primary health and social services provider, health regions and all of Québec, 2025
Sources
Data on the proportion of the population: Institut de la statistique du Québec, Québec Survey on the Use of Health and Social Services, 2025.
Data on health region boundaries: Ministère de la Santé et des Services sociaux, health region boundaries in 2021.
High income households are more likely to live near urban green spaces
In Québec, the proportion of households living near an urban green space is higher among those with an after-tax income of $125,000 or more (41%) than among those whose income is below $40,000 (34%). The largest gaps in favour of affluent households are observed in Lanaudière (13 percentage points), Outaouais (12 points), Laurentides (11 points), and Montérégie (11 points).
The fleet of light electric vehicles has increased tenfold since 2019
As of March 31, 2026, the number of light electric vehicles reached 447,400 in Québec, up from 43,200 in 2019. Vehicle electrification continued in all Québec regions despite a slowdown in the last year. The regions of Lanaudière, Montérégie, Estrie and Laurentides have the highest number of electric vehicles per capita in the province, with over 750 vehicles per 10,000 people.
See also:
A quick look at each of Québec’s regions (in French only)
The Institut de la statistique du Québec is the public body responsible for providing reliable, objective statistics about Québec society. The relevance of its work makes it a strategic ally for decision makers and an essential source of information for all those wishing to learn more about Québec.