
Québec, March 17, 2025. – In 2019, the carbon footprint of all households totalled 78,415 kilotonnes of CO2 equivalent (kt of CO2 eq.). This represents a 3% increase from the revised carbon footprint for 2017 (76,368 kt of CO2eq.), on which data was also published today. On a per capita basis, however, the carbon footprint of households remained unchanged between 2017 and 2019, at 9.2 tonnes per capita.
The Institut de la statistique du Québec published new data on the carbon footprint of Québec households, according to an enhanced calculation method.
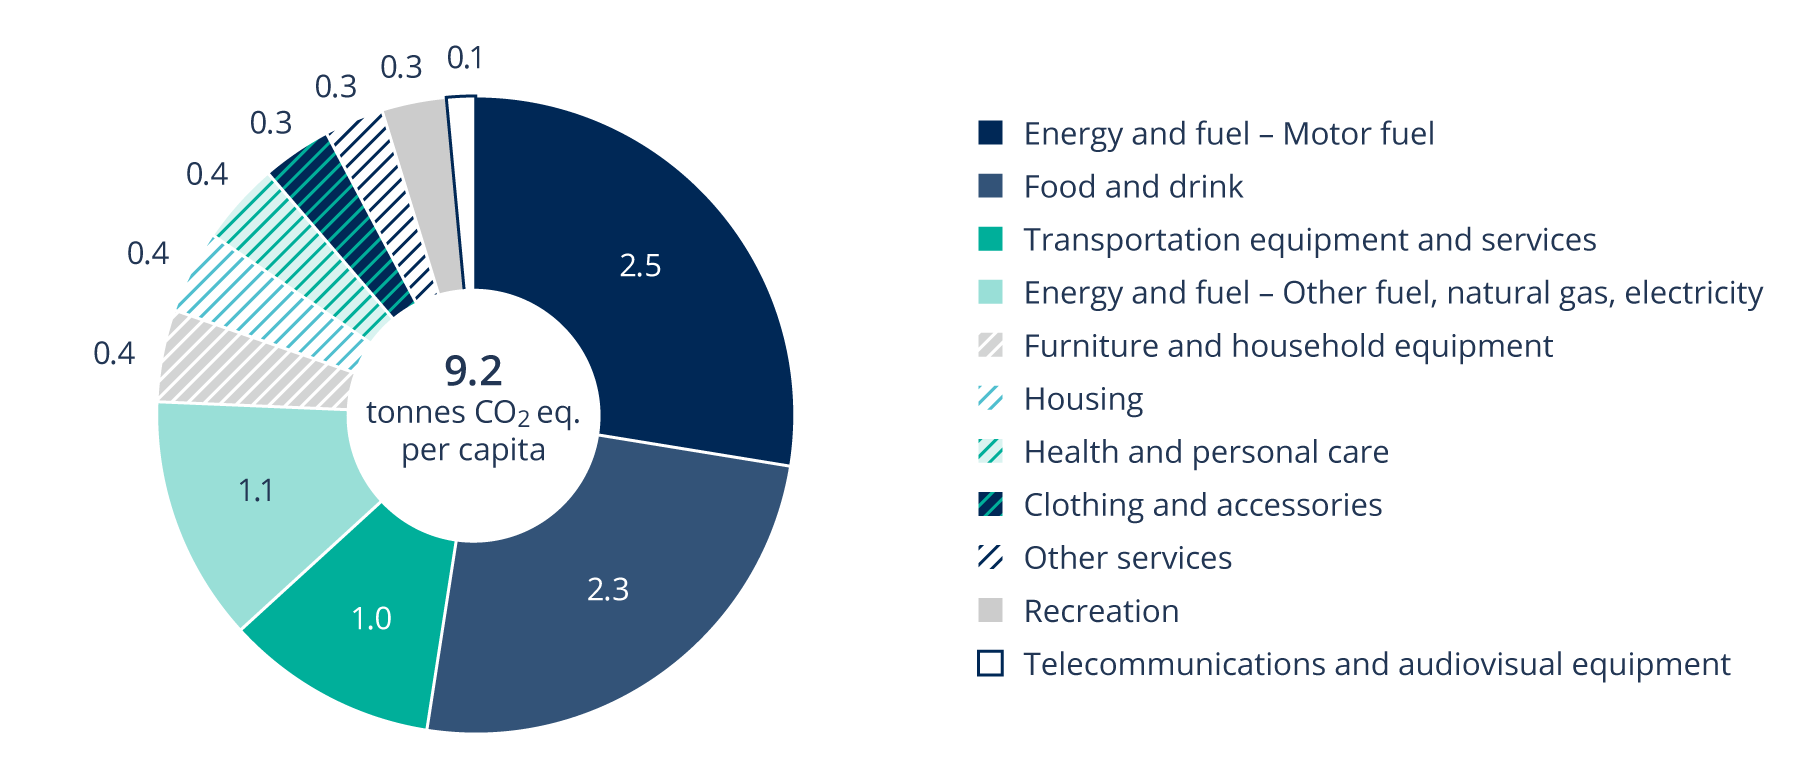
Transportation and food make up over 60% of households’ carbon footprint
The Energy and fuel – Motor fuelcategory accounts for the largest share of Québec households’ carbon footprint (28%). Greenhouse gas (GHG) emissions associated with this category are mainly generated by households when they drive their vehicles.
The Food and drink category comes in second place (25%). Transportation equipment (e.g., vehicle purchase or lease) and services (e.g., public transit, air transportation, repair and maintenance) rank third (11%).
Per capita carbon footprint from household demand in Québec, by category of goods and services, 2019
Total: 9.2 tonnes of CO2 eq. per capita
Source
Institut de la statistique du Québec
The Institut also published four analyses that break down the carbon footprint for 2019 according to household characteristics:
By household type
- Couples with one or more children generate the largest share (37%) of the total carbon footprint of households. These households account for about 44% of the population.
- Per capita, the carbon footprint of couples with one or more children is one of the lowest among the types of households studied (7.8 tonnes of CO2 per capita), while that of people living alone is the highest (11.8 tonnes of CO2 eq. per capita).
By household income quintile before tax
- The carbon footprint of households in the top income quintile ($121,237 or more) is higher than the footprint of every other quintile. These households generate 32% of the total carbon footprint while accounting for about 29% of the population.
- On average, households in the top income quintile have a carbon footprint 3.4 times higher than that of households in the bottom income quintile. More specifically, their carbon footprint is:
- 3.4 times higher for the Energy and fuel category.
- 3.1 times higher for the Food and drink category.
- 5.1 times higher for the Transportation equipment and services category. The carbon footprint associated with air transportation of households in the top quintile is 6 times higher.
- On a per capita basis, the carbon footprint of households in the top income quintile (10.0 tonnes of CO2 per capita) is higher than that of the other quintiles.
By place of residence
- Households in the six census metropolitan areas (CMAs) account for 69% of Québec households’ carbon footprint. These areas comprise about 71% of all households and 72% of the population in the province.
- Around 37% of the carbon footprint of households located in CMAs is associated with spending on Energy and fuel. This share is higher among households outside CMAs (48%).
- People living in Québec’s six CMAs have a lower per capita carbon footprint (8.9 tonnes of CO2 per capita) than people living outside CMAs (10.0 tonnes of CO2 eq. per capita).
By age of household reference person
- Households where the reference person is aged between 45 and 64 make up the largest proportion (43%) of households’ total carbon footprint. These households account for about 41% of the population.
- Per capita, the carbon footprint of households where the reference person is aged between 30 and 44 is lower (8.0 tonnes of CO2 per capita) than that of other age groups (9.7 tonnes of CO2 eq. per capita).
Learn more about the carbon footprint according to household characteristics
The carbon footprint of households
The carbon footprint of households corresponds to the greenhouse gas (GHG) emissions produced to meet household consumption needs, whether generated by the households themselves or by the economic sectors that supply them with the goods and services they require.
The carbon footprint measures emissions generated by household consumption in Québec (40,849 kt of CO2 eq. in 2019), elsewhere in Canada (11,523 kt of CO2 eq.), and elsewhere on the planet (26,043 kt of CO2 eq.). Estimated GHG emissions outside Canada now include carbon dioxide, methane, nitrous oxide, and fluorinated gases.
For 25 years, the Institut de la statistique du Québec has been producing, analyzing, and disseminating official, objective and high-quality statistical information on various aspects of Québec society. It is responsible for conducting all statistical surveys of general interest. The relevance of its work makes it a strategic ally for decision makers and an essential source of information for all those wishing to learn more about Québec.