
Montréal, September 4, 2020. – In August 2020, employment was up 54,200 (+1.3%) in Québec from July 2020. The unemployment rate declined 0.8 percentage points in August to 8.7%. These are the main highlights of the employment and labour force data based on the results of Statistics Canada’s Labour Force Survey released today.
Employment increased by 630,200 over the past four months, which is equivalent to more than three quarters (76.8%) of the 820,500 jobs lost between February and April 2020.
In August, full-time employment (+60,900) was up, while part-time employment remained stable (-6,700). Employment increased in the private sector (+80,800), while the public sector (-13,900) and self-employment (-12,700) both posted declines. The participation rate rose by 0.2 points to 64.5% and the employment rate increased 0.8 points to 58.9%.
In Canada, employment was up by 245,800 (+1.4%) in August. The unemployment rate declined 0.7 points to 10.2%. The largest employment gains were recorded in Québec, Ontario (+141,800), and British Columbia (+15,300).
In the first eight months of 2020, employment in Québec decreased by 255,000 compared with the same period last year. During this period, full-time employment declined by 128,600, while part-time employment fell by 126,400. Since the beginning of 2020, the unemployment rate in Québec has averaged 9.6% (Canada: 9.8%).
A word of caution regarding the effects of COVID-19 on EPA data
As in March, April, May, June and July, the effects of the COVID-19 crisis on the labour market in August must be interpreted with caution when analyzing Labour Force Survey (LFS) data.
The survey reference period for August is August 9 to 15. As a result, the effects on employment and unemployment of certain measures taken by the Québec government may have been measured by the survey. Such measures include the authorization to reopen offices at 25% capacity, which came into force on July 18.
It may also have been more difficult to correctly categorize individual labour force status according to the usual definitions of employment, unemployment1 and inactivity in this edition of the survey.
In addition, the gradual phase-out of containment measures at different rates from one province to another may affect interprovincial comparisons.
A longer analysis period will be necessary to assess the trend effects of the COVID-19 pandemic on the Québec labour market. It should also be noted that the monthly data are based on a sample and are therefore subject to a certain amount of variability. Statistics Canada’s The Daily provides detailed analyses of the pandemic’s impact on the labour market in August 2020.
The LFS estimates for administrative regions, seasonally adjusted by the Institut de la statistique du Québec, are published as three-month moving averages to smooth out irregular fluctuations due to small sample sizes. For more information on the interpretation of these data, please refer to Quelques rappels concernant les moyennes mobiles sur trois mois (MM3M) (in French only).
_________
1The Labour Force Survey defines unemployed persons as those who, during the reference week: 1- were on temporary layoff with an expectation of recall and were available for work, or 2- were without work, had looked for work in the past four weeks, and were available for work, or 3- had a new job to start within four weeks, and were available for work.
Changes in employment and trend-cycle data, Québec, August 2019 to August 2020
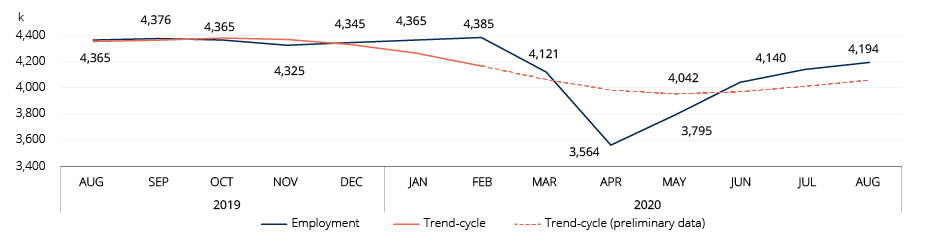
Note: Trend-cycle data are a smoothed version of seasonally-adjusted data where the effects of irregular movements have been reduced. They are helpful in analyzing long-term changes in the data. For more information: Statistics Canada, Trend-cycle estimates – Frequently asked questions.
Source: Statistics Canada, Labour Force Survey, 2020. Adapted by the Institut de la statistique du Québec.
Changes in the unemployment rate, Québec, August 2019 to August 2020
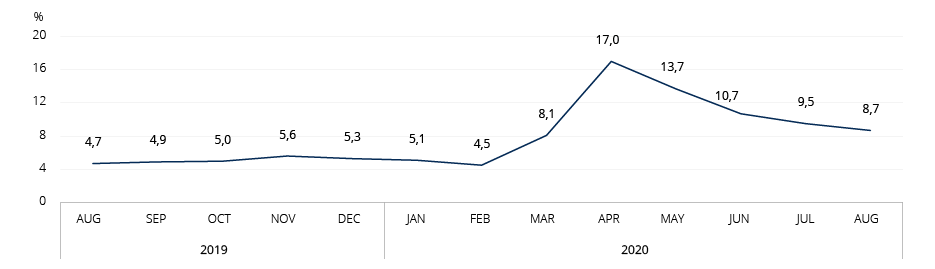
Source: Statistics Canada, Labour Force Survey, 2020. Adapted by the Institut de la statistique du Québec.
The Institut de la statistique du Québec produces, analyzes and disseminates official, objective and quality statistical information on various aspects of Québec society. It is responsible for conducting all statistical surveys of general interest. The relevance of its work makes it a strategic ally for decision makers and all those wishing to learn more about Québec.